


As a customer-obsessed company we’re always on the lookout for opportunities to help our customers solve their problems. Over the last number of months a common theme has emerged — the lack of visibility into how data in cloud object storage (starting with Amazon S3 and Google Cloud Storage) is being accessed. This is especially true when operating at petabyte-scale as AI often does, with billions of objects, multiple factors of that in access operations, high volumes of writes/overwrites, etc. Unstructured data in cloud object stores represents the largest surface area for breach risk, and that surface area continues to rapidly expand.
This lack of visibility at scale makes it really hard for FinOps, security, and engineering teams to optimize the application environment for cost, to ensure compliance, to enable chargeback, improve performance and more. So, we’re excited to announce an Early Access Preview of Granica Chronicle, which provides rich analytics for your data with a deep focus on access.
The visibility problem
Visibility tools from the big cloud vendors have a Goldilocks problem in that they are either too simple and high level (e.g. S3 Storage Lens) or too complex and detailed (e.g. AWS Server Access Logs and S3 Inventory report) to be of much use. Moreover, the data from these tools are in silos. Our customers need something in the sweet spot, i.e. a user-friendly analytics environment which brings the data from these disparate silos together to quickly answer important questions such as:
Is my data secure and compliant? This requires answering deeper questions such as:
- Who/what is accessing the data, when, what types of data are being accessed, and is that access allowed/expected? Useful to determine if there is rogue/shadow access that should be stopped (and investigated).
- When/where did access errors occur? Useful to determine if there is attempted rogue/shadow access.
- From which region is that access originating? Useful to determine if access violates GDPR or other compliance regulations
- Do I have unencrypted data, or publicly accessible data? Useful to assess and minimize risk of breach or data loss.
- Do I have over-provisioned access policies (e.g. allowing edit/delete)? Useful to assess and minimize risk of breach or data loss.
- Who made configuration/policy changes, and when? Useful for maintaining an audit trail, and determining if there are rogue changes.
Do I have significant opportunities for cost optimization? This requires answering:
- Who/what is accessing the data, when? Useful to determine if certain compute resources should be terminated.
- What is the access performance profile for distinct data sets (e.g. p50, p90, p99 latencies)? Useful to determine the baseline performance/SLA to service applications.
- What is the read pattern over the life of each object/bucket? Useful to define an optimal lifecycle policy across tiering and deletion.
- What is the predicted impact on cost, performance, and availability *if* I change my storage class and/or lifecycle policy from x to y? Useful for “What if?” scenario planning and analysis.
- Is my prefix approach sub-optimal, and causing performance problems (and raising compute costs) on read access?
Can I allocate costs and enable showback (or better chargeback) to the application teams driving those costs? This requires answering:
- Who/what is accessing which data, and how much data is being accessed? Useful to stratify access and identify heavy users.
Introducing Granica Chronicle
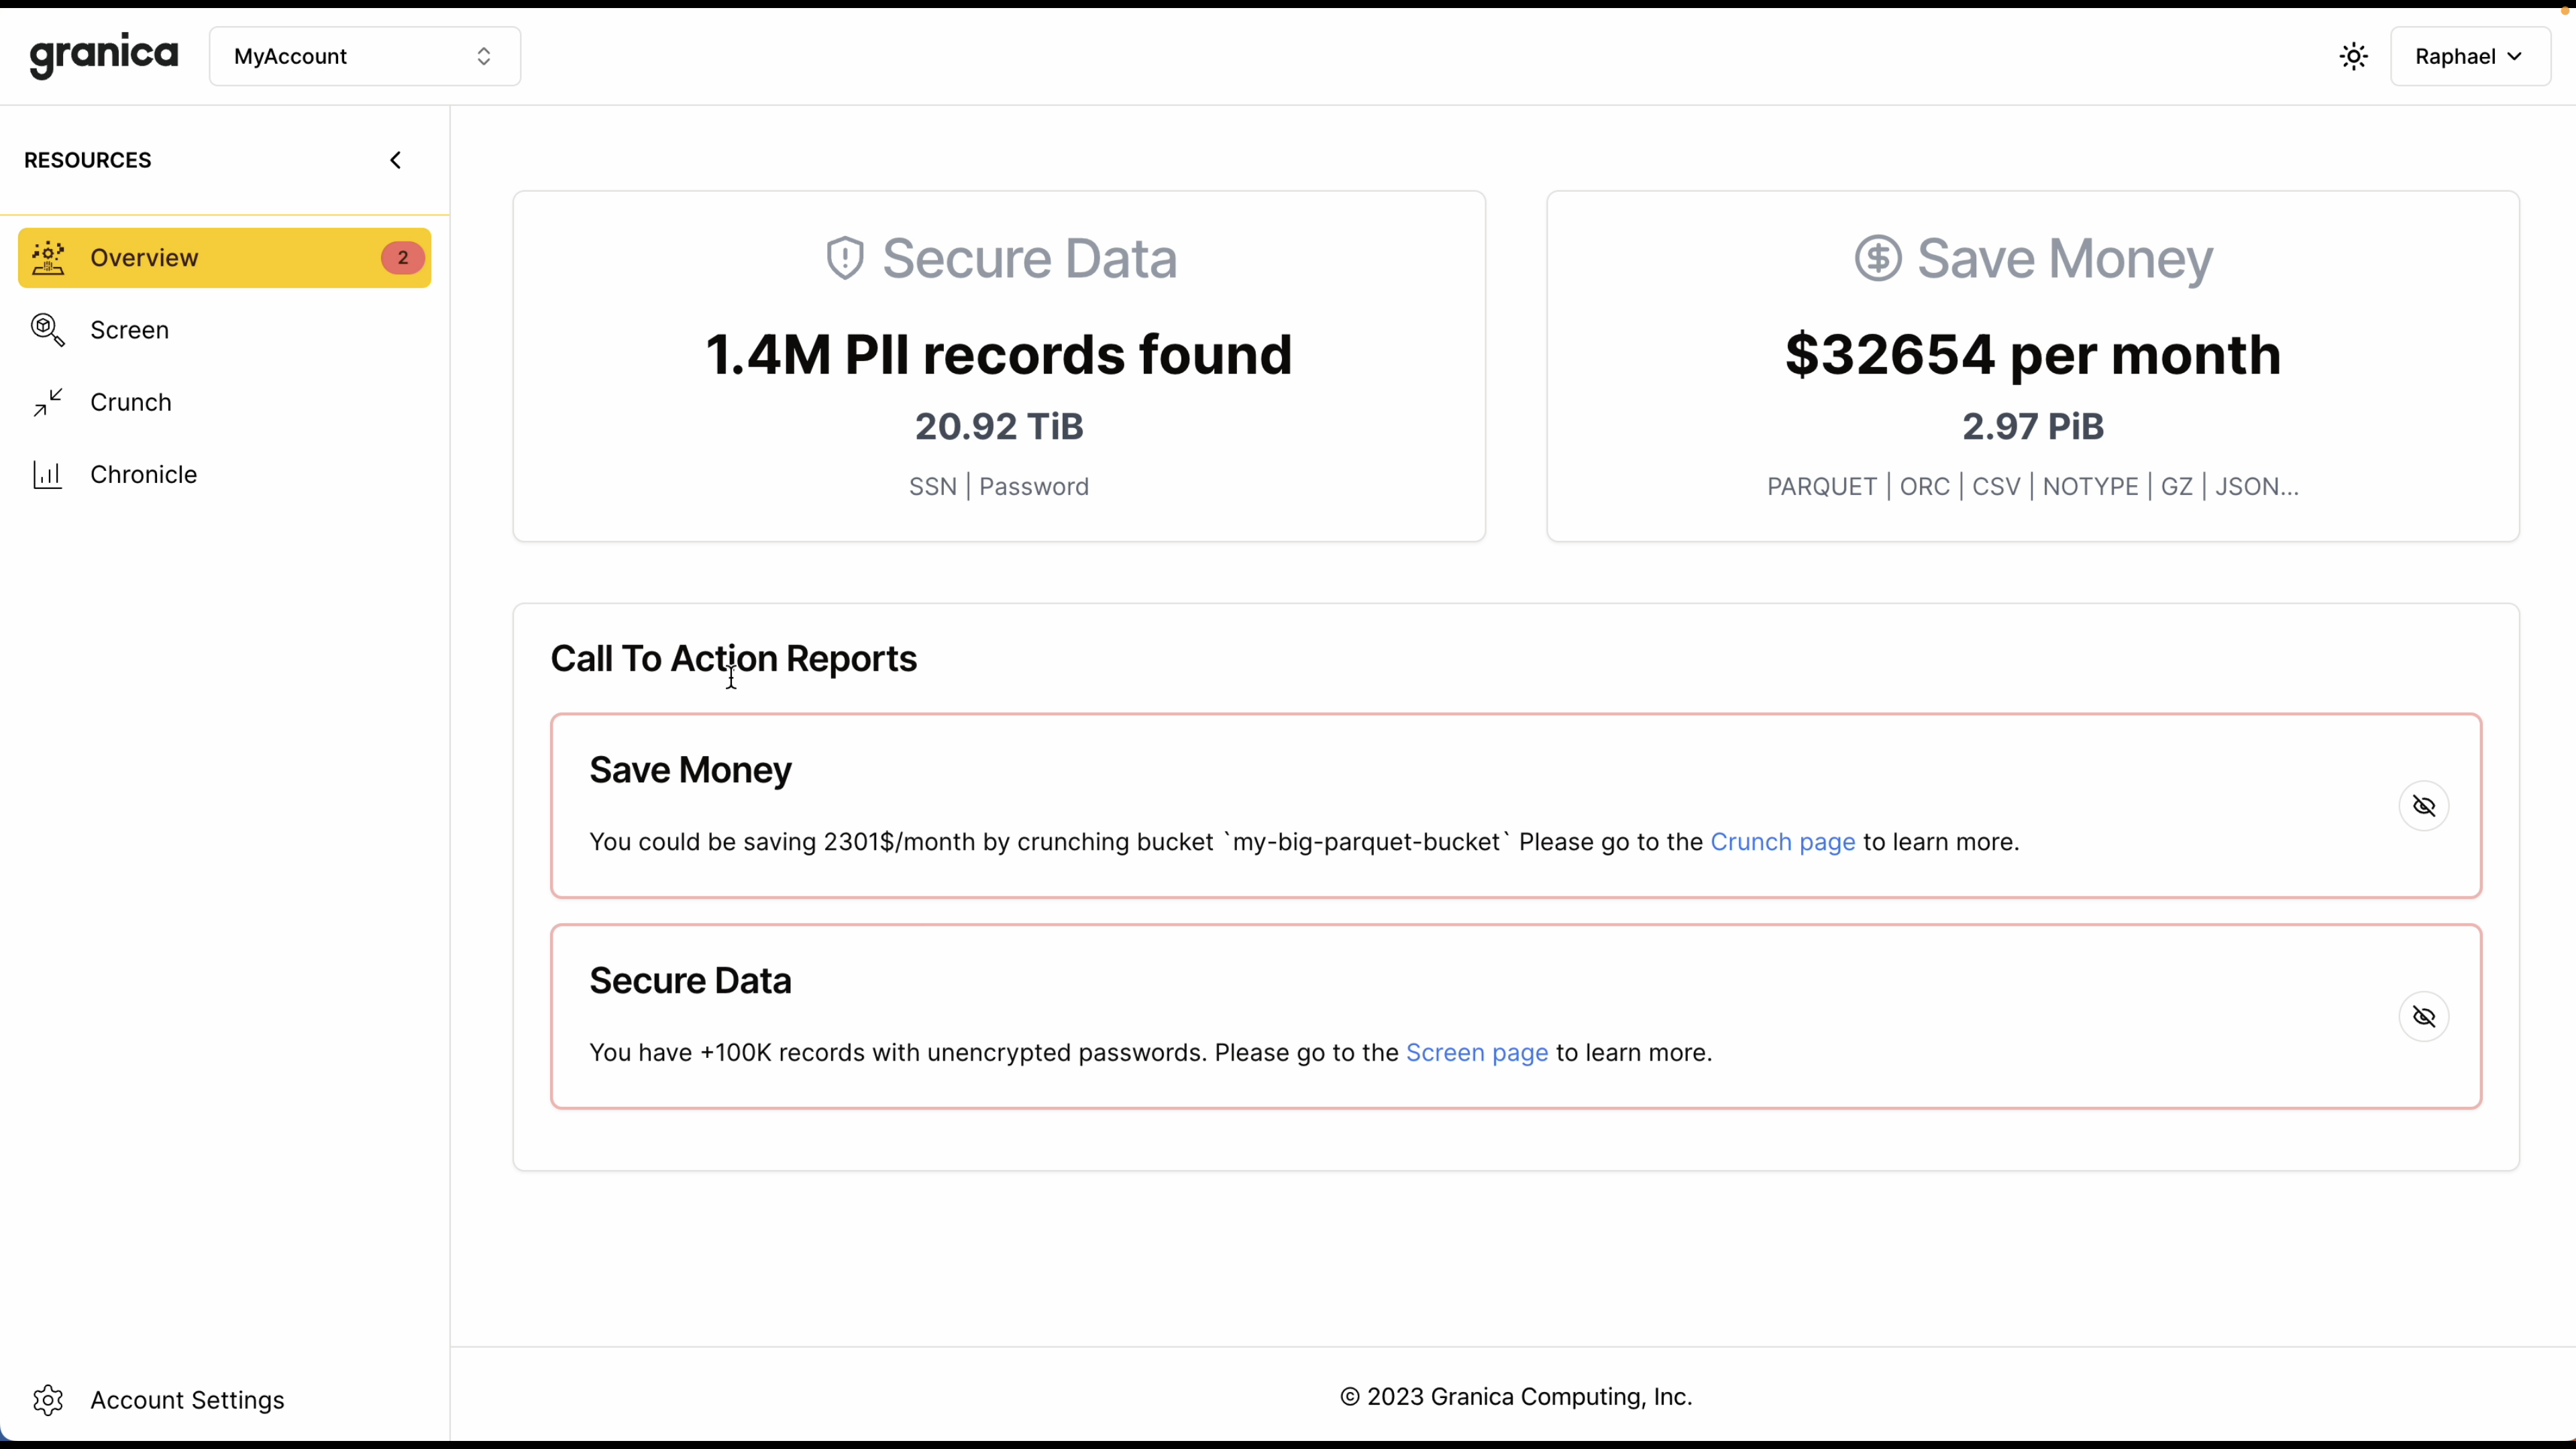
Granica Chronicle is a new SaaS offering designed to answer these important questions via an AI-powered, natural language interface which makes exploration, visualization, and collaboration incredibly easy. Simply enter in your prompts (i.e. questions) and you’ll be presented with relevant visualizations in graphs and tables that uncover actionable insights, fast.
Here's a brief demo showing the prompt-based interface in action, focused on parquet files as these are commonly used by organizations for analytics:
Chronicle is also collaborative, enabling you to participate in a shared view of prompt-based results and history with other cross-functional Chronicle users across your organization. For example, if you’re a security and compliance professional using Chronicle to identify potential rogue access (say from internal compute instances), you can easily share your active prompt view with your FinOps peers so they can use Chronicle to estimate the costs savings from terminating them. And you can share your prompt view with application owners so they can use Chronicle to identify potential opportunities to increase performance. And all without any knowledge of SQL from any user. Under the covers, Chronicle itself leverages (or “dogfoods”) other Granica AI services to maximize its own efficiency.
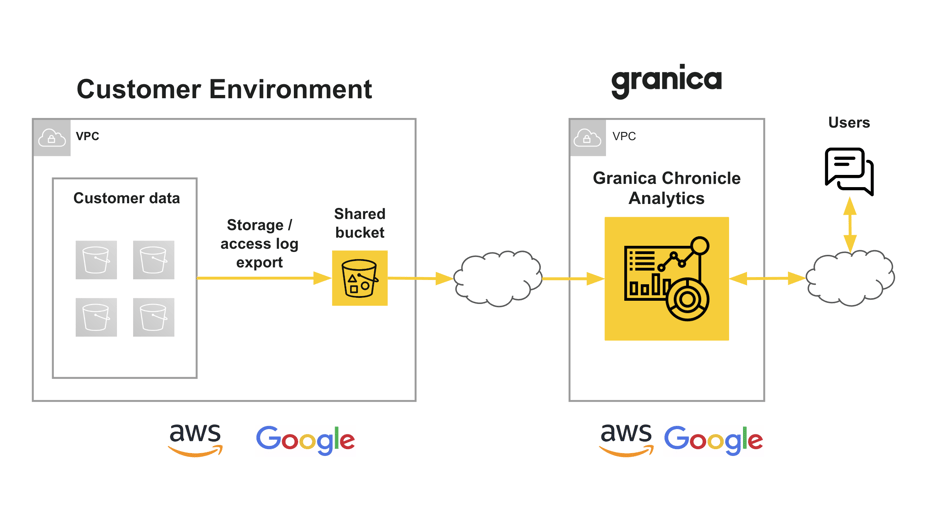
Getting started is simple:
- You create a Granica Chronicle account in our SaaS console.
- Our team helps you configure exports for the relevant object store and server access logs freely available from your cloud provider. We’ll also help you share those logs with our Chronicle SaaS instance via a shared bucket.
- Chronicle ingests those data sets and readies them for prompt-based exploration.
- That’s it! You can start asking questions of your data (literally).
And here's the architecture:
Finally, here’s a sneak peek at some of the more sophisticated natural language queries and views Chronicle will support/provide (stay tuned):
- Show me all users that have accessed buckets in S3 in the last 7 days from the 'eu-central-1' region with 'read-only' permissions?
- Show me all roles that are sending PUT requests to objects in S3 between January and March across all regions with 'write' access?
- Show me all Python apps that have permissions to delete particular_bucket_name in S3 in the last 60 days from the 'us-east-2' region?
Chronicle also speeds time to value for Granica Crunch and Screen
Perhaps not surprisingly, the visibility that Chronicle provides is also incredibly helpful for onboarding our Granica Crunch and Screen customers. Chronicle prioritizes buckets and applications for integration, taking into account many of the previously discussed factors, as well as others such as the dollar savings potential resulting from estimated data reduction across various file types.
Chronicle also represents the first phase in our build out of a graphical SaaS control plane for our entire platform. Chronicle will be the first Granica product available via that control plane, and we'll quickly be following it with Crunch, Screen, and the other cool products in our AI efficiency roadmap. Here's a sneak peek at how it'll look - stay tuned for updates!
Get early access
Chronicle is shaping up nicely but we’re always looking for ways to make it even better. So, apply for early access today if you’d like to help shape the direction of Chronicle and start benefiting from it right away.
Want to discuss? Share your comments/questions below